The smart Kd-concept was applied to a two-dimensional schematic model (Flügge, 2009) for the Gorleben reference site (Noseck et al., 2012). Density-driven flow and transport were modelled with the codes d3f and r3t, respectively. Starting from the present state, constant climatic and boundary conditions are assumed for a simulation period of 150,000 a (see Fig. 1). Subsequently, the lateral boundaries are closed, and a time-dependent pressure boundary condition is defined at the surface representing a seawater transgression for 5,000 a, a sea-level high-stand at 50 m for another 5,000 a, and a regression for 5,000 a.
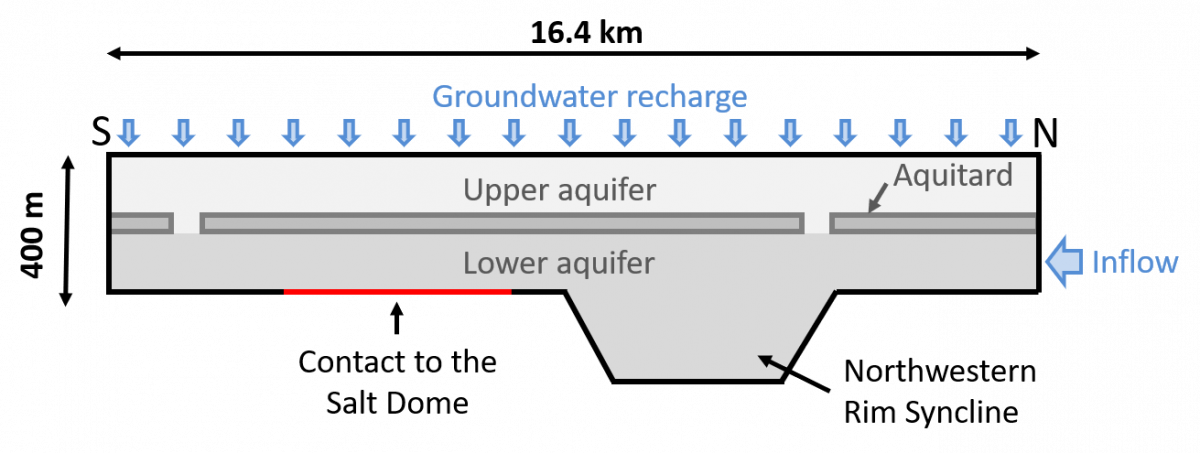
Fig. 1: Geometry of the full-scale groundwater flow and transport model (all figures of the model and simulation results are exaggerated by a factor of 10).
The results of the transient groundwater flow simulations after 150,000 a (future constant climate) and 165,000 a model time (sea water inundation) are shown in Fig. 2. Salt is constantly dissolved at the contact zone of the salt dome to the lower aquifer. For the future constant climate, however, the brine is mixed with fresh water from the groundwater recharge and the inflow into the lower aquifer as defined by the boundary conditions. Consequentially, the upper aquifer and the northern part of the lower aquifer have freshwater conditions, and the water in the north-western rim syncline has a relative salt concentration of 0.4 to 0.6.
The sea water inundation results in an almost horizontal stratification of the groundwater with increasing density with depth after 165,000 a model time (Fig. 2). The upper aquifer shows a salt concentration equal to that of the sea water, and a relative salt concentration of about 0.8 is reached in the north-western rim syncline. As the inflow of fresh water is ceased, convection is the main mixing mechanism in the aquifers whereas diffusion governs the transport within the aquitard.
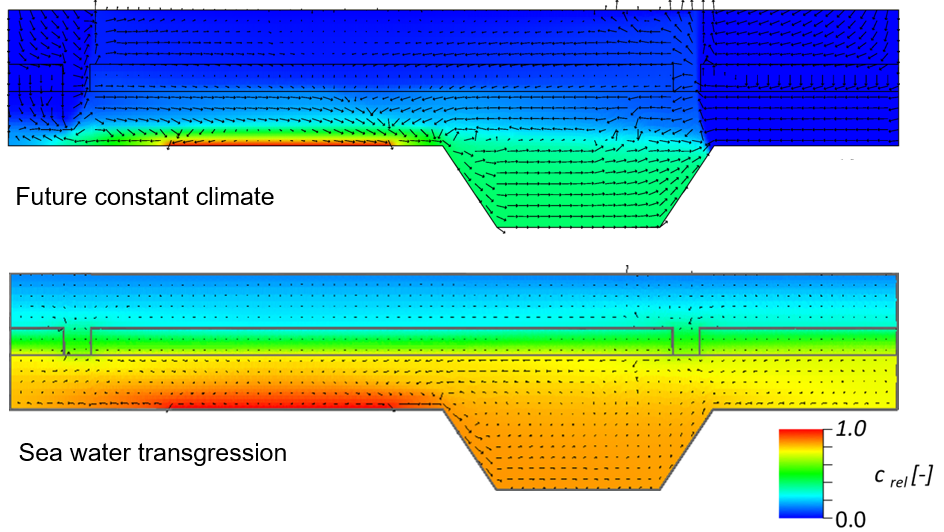
Fig. 2: Relative salt concentration and velocity field for constant boundary conditions for the future constant climate (top) and the sea water transgression (bottom); length of velocity vectors is proportional to velocity. Colours indicate the relative salt concentration (blue = fresh water; red = saturated brine).
The environmental parameters Ca, DIC, and pH change over time according to the flow field, the boundary conditions and the geochemical interactions of the environmental parameters as stated by the smart Kd-concept. For example, rainwater contains lower concentrations of Ca and DIC than the upper aquifer. As a result, calcite is dissolved in recharge areas in the north and south of the model which increases the pH. The combination of the environmental parameters and the properties of the sediments determine the smart Kd-value for a certain radionuclide. The influence of the pH value on the smart Kd-value can be observed for Cs in Fig. 3.
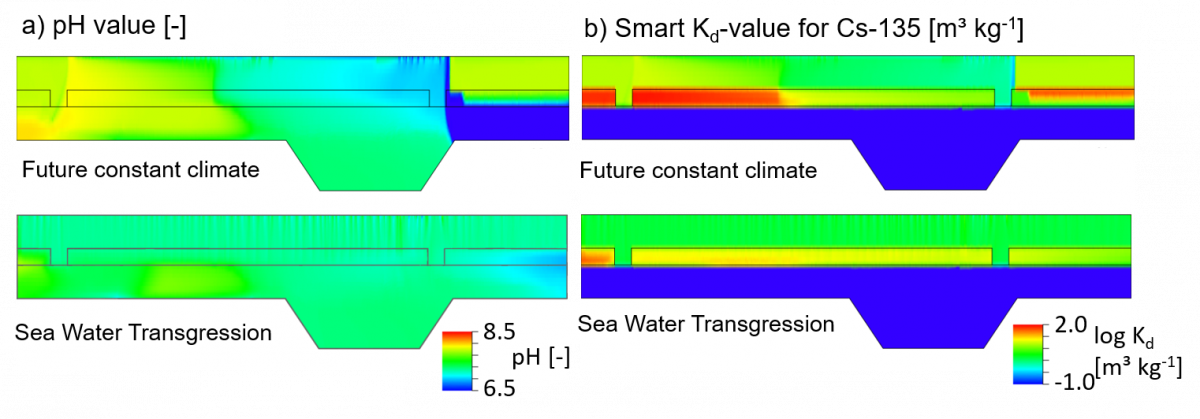
Fig. 3: Distribution of a) pH and b) the corresponding smart Kd-values for Cs-135 after 160,000 a (top), and 175,000 a simulation time (bottom).
A stylized inflow as point source with a constant flux in a time frame between 1,000 and 100,000 a is assumed for the transport of Cs. The distribution of Cs-135 after 175,000 years model time is shown in Fig. 4 both for the conventional Kd and the smart Kd. After upward and northward transport through the lower aquifer, the aquitard is reached with both concepts. Using conventional Kd-values, Cs-135 crosses the aquitard and the upper aquifer and reaches the model surface vertically above the contact with the salt dome. Employing the smart Kd-approach, however, Cs-135 is retarded strongly within the aquitard and does not reach the upper aquifer.
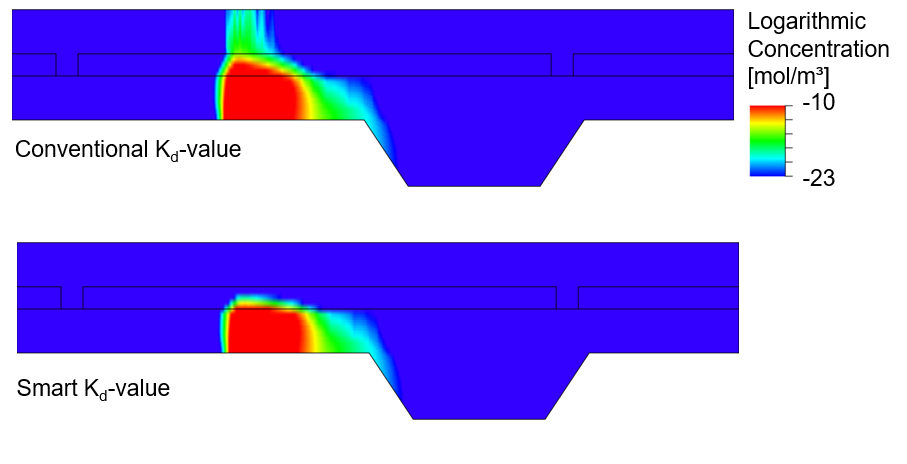
Fig. 4: Distribution of Cs-135 after 175,000 a modelled with conventional Kd-value (top) and with smart Kd-value (bottom).
The transport of the radionuclides is dominated by advection. The environmental parameters reflect well the interaction of the initial and boundary conditions as well as the mixing processes and thus the changes of the geochemical environment. The impact of the environmental parameters on the distribution coefficients of Cs can be well retraced. A comparison of CPU times needed for the transport simulations employing the conventional Kd‑value with those using the smart Kd‑concept shows only an increase by a factor of 3 – 3.5, which is fully feasible for long-term safety assessment calculations. A detailed description of the model and the simulation results can be found in Noseck et al (2012).
Contact: Dr. Ulrich Noseck, Dr. Judith Flügge
References:
Flügge, J., Radionuclide Transport in the Overburden of a Salt Dome – The Impact of Extreme Climate States, Verlag Dr.Hut, München 209 p (2009).
Noseck, U., Brendler, V., Flügge, J., Stockmann, M., Britz, S., Lampe, M., Schikora, J., Schneider, A.: Realistic integration of sorption processes in transport codes for long-term safety assessments, Final Report GRS-297, (Gesellschaft für Anlagen- und Reaktorsicherheit (mbH)), Braunschweig, 293 p (2012).